Let's make maps layout with external geojson file.
- JSON file
{"type":"FeatureCollection","features":[ {"type":"Feature","properties":{"name":"Afghanistan"},"geometry":{"type":"Polygon","coordinates":[[[61.210817,35.650072],[62.230651,35.270664],[62.984662,35.404041],[63.193538,35.857166],[63.982896,36.007957],[64.546479,36.312073],[64.746105,37.111818],[65.588948,37.305217],[65.745631,37.661164],[66.217385,37.39379],[66.518607,37.362784],[67.075782,37.356144],[67.83,37.144994],[68.135562,37.023115],[68.859446,37.344336],[69.196273,37.151144],[69.518785,37.608997],[70.116578,37.588223],[70.270574,37.735165],[70.376304,38.138396],[70.806821,38.486282],[71.348131,38.258905],[71.239404,37.953265],[71.541918,37.905774],[71.448693,37.065645],[71.844638,36.738171],[72.193041,36.948288],[72.63689,37.047558],[73.260056,37.495257],[73.948696,37.421566],[74.980002,37.41999],[75.158028,37.133031],[74.575893,37.020841],[74.067552,36.836176],[72.920025,36.720007],[71.846292,36.509942],[71.262348,36.074388],[71.498768,35.650563],[71.613076,35.153203],[71.115019,34.733126],[71.156773,34.348911],[70.881803,33.988856],[69.930543,34.02012],[70.323594,33.358533],[69.687147,33.105499],[69.262522,32.501944],[69.317764,31.901412],[68.926677,31.620189],[68.556932,31.71331],[67.792689,31.58293],[67.683394,31.303154],[66.938891,31.304911],[66.381458,30.738899],[66.346473,29.887943],[65.046862,29.472181],[64.350419,29.560031],[64.148002,29.340819],[63.550261,29.468331],[62.549857,29.318572],[60.874248,29.829239],[61.781222,30.73585],[61.699314,31.379506],[60.941945,31.548075],[60.863655,32.18292],[60.536078,32.981269],[60.9637,33.528832],[60.52843,33.676446],[60.803193,34.404102],[61.210817,35.650072]]]},"id":"AFG"},
{"type":"Feature","properties":{"name":"Angola"},"geometry":{"type":"MultiPolygon","coordinates":[[[[16.326528,-5.87747],[16.57318,-6.622645],[16.860191,-7.222298],[17.089996,-7.545689],[17.47297,-8.068551],[18.134222,-7.987678],[18.464176,-7.847014],[19.016752,-7.988246],

...
Let's make maps layout with this guys.
- HTML document
<!DOCTYPE html>
<html lang="en">
<head>

    <title>D3JS</title>
    <script src="https://d3js.org/d3.v4.min.js"></script>
    <script src="//d3js.org/d3.geo.projection.v2.min.js"></script>
    <style type="text/css">

    </style>

</head>
<body>
    <script>

        var canvas = d3.select("body").append("svg")
            .attr("width", 1960)
            .attr("height",1500);

        // d3.json("geo.geojson", function (data) {
        d3.json("http://enjalot.github.io/wwsd/data/world/world-110m.geojson" /*"geo.geojson"*/, function (data) {
            console.log(data.features)
            var group = canvas.selectAll("g")
                .data(data.features)
                .enter()
                .append("g")

            var projection = d3.geoMercator().scale(500).translate([0,500]);
            var path = d3.geoPath().projection(projection);
            //pass in the projection to path generator using the projection method
            //in order to translate coordinates(from geo.geojson) to pixels on the canvas

            var areas = group.append("path")
                .attr("d", path)
                .attr("class", "area")
                .attr("fill", "orange");

            group.append("text")
                .attr("x", function(d) {return path.centroid(d)[0];})//the centroid calculates the center of the path
                //and i give the data as an argument
                //and this returns an array of two numbers which correspond to x-coordinate, y-coordinate
                //so zero means which returns with x-coordinate
                .attr("y", function(d) {return path.centroid(d)[1];}) //returns with y-coordinate
                .attr("text-anchor", "middle")
                .text(function (d) {return d.properties.name;})
                .style("font", "15px times")

        });


    </script>
</body>
</html>
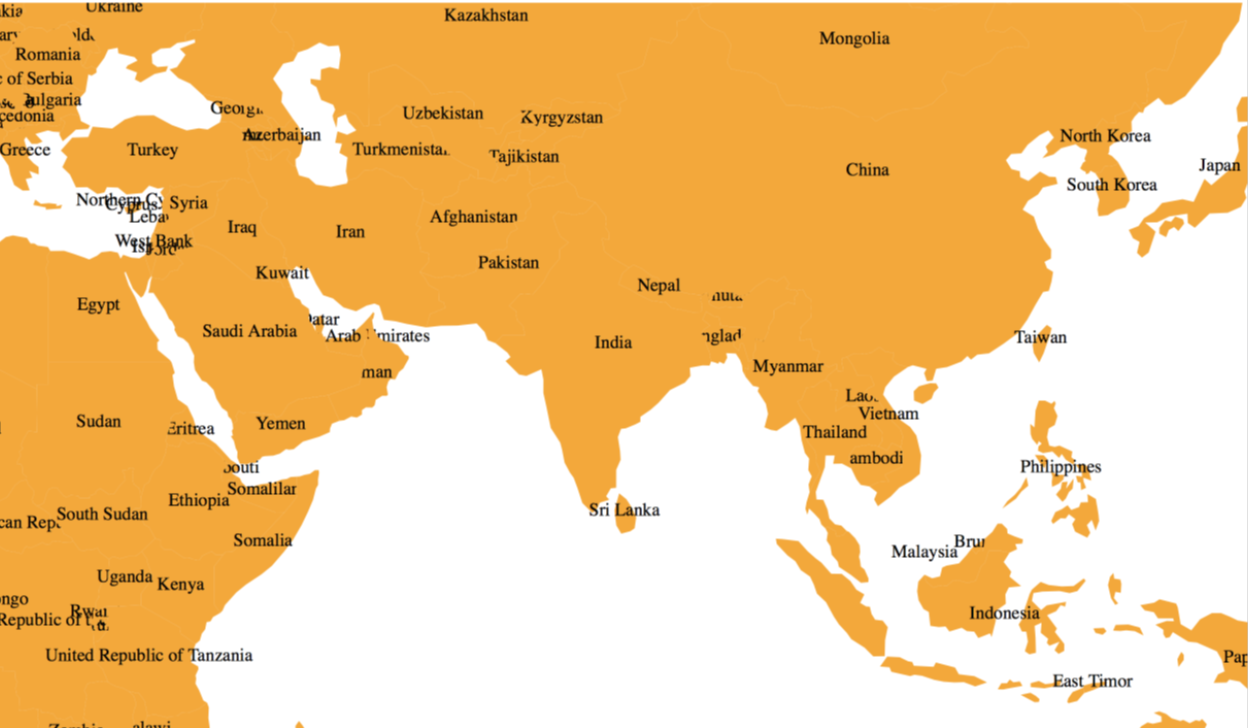
- Result
'd3.js' 카테고리의 다른 글
| apply my data to d3.js(Chord diagram, Sunburst diagram, Zoomable diagram) (0) | 2021.01.26 |
|---|---|
| D3, DOM, select, selectAll, .data, .enter, .append, .text, .exit (0) | 2021.01.04 |
| treemap, category10, children, text-anchor (0) | 2020.12.31 |
| histogram, linear, axis, map (0) | 2020.12.31 |
| histogram layout, parseInt (0) | 2020.12.30 |