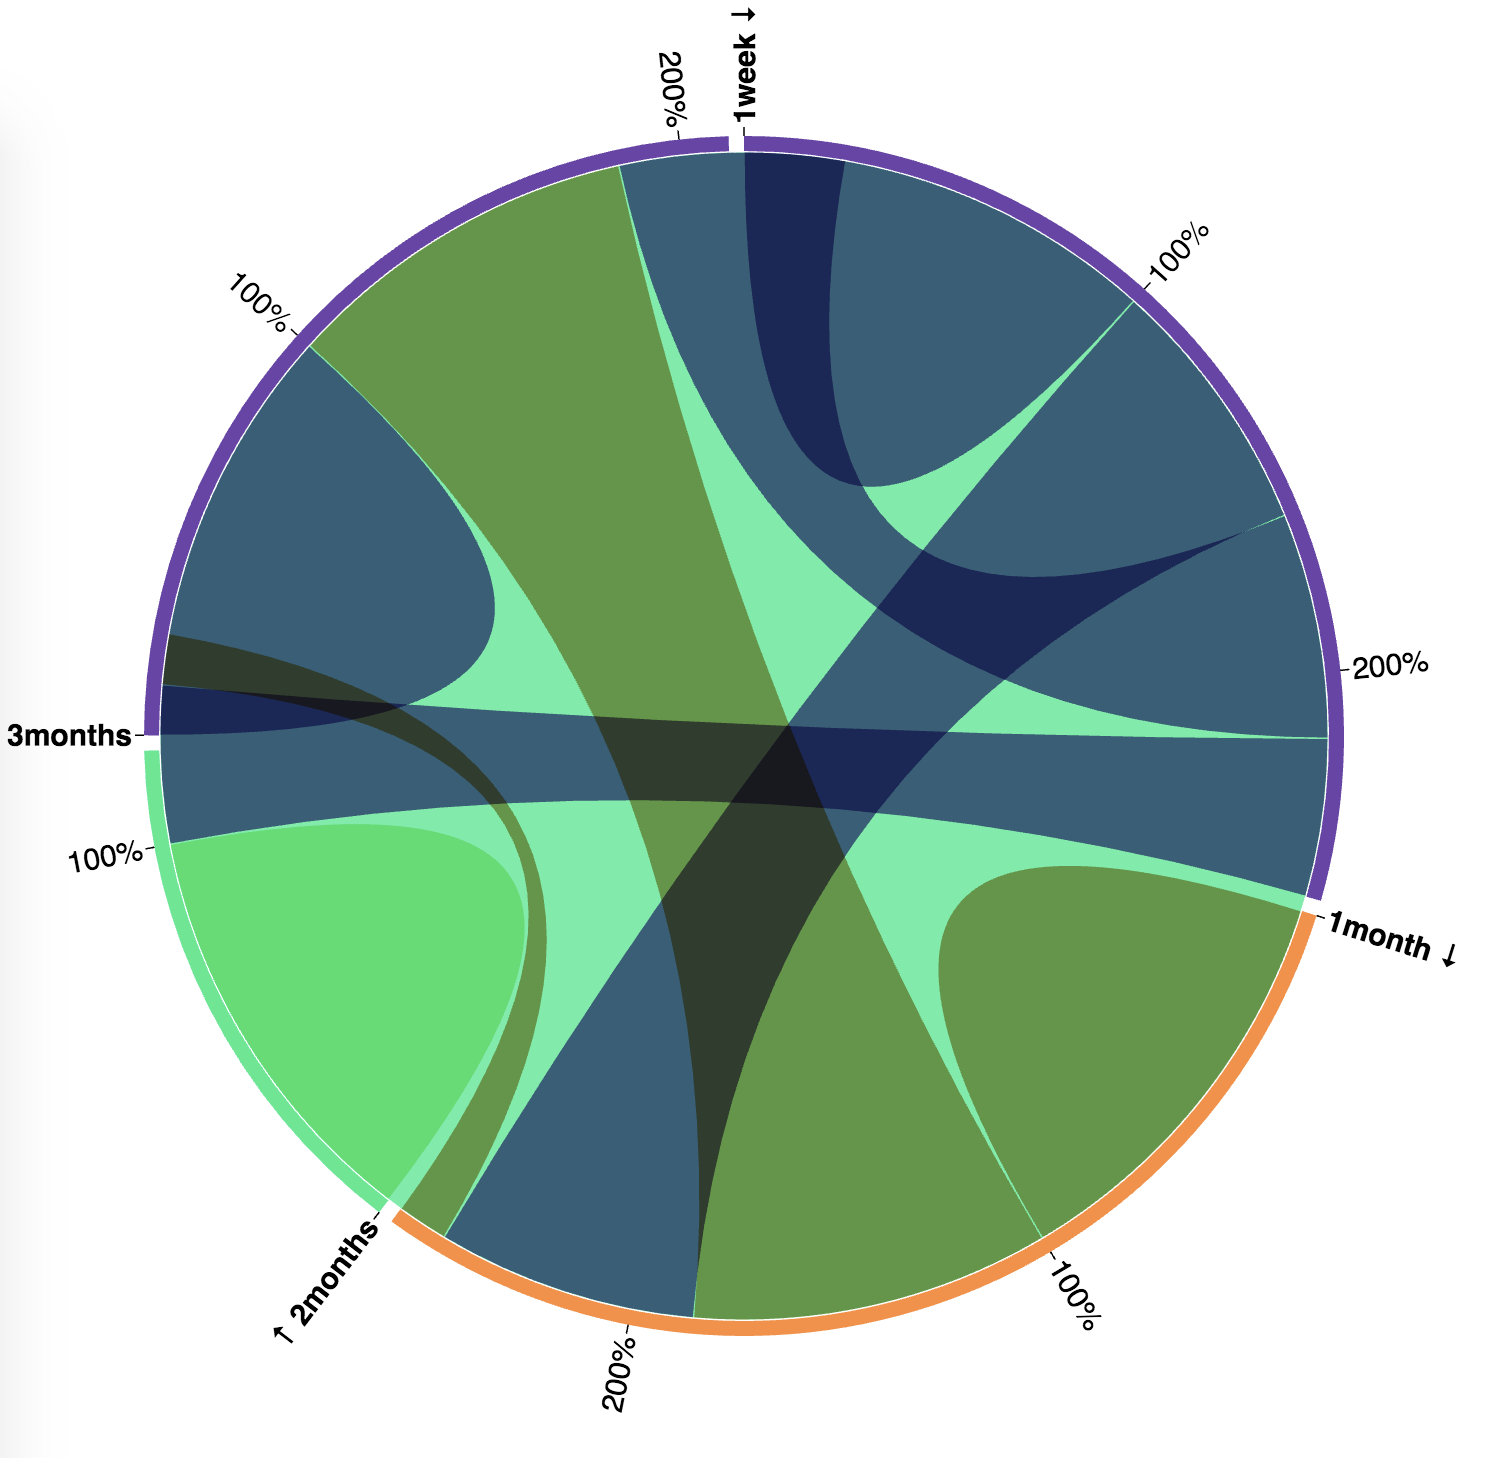
apply my data to d3.js(Chord diagram, Sunburst diagram, Zoomable diagram) Prior to make diagrams with d3.js, let's summarize what I learn. I choose 3 types of d3 diagrams fit with my datas. Summarize Result-Chord diagram Result-Chord diagram Result-Sunburst diagram Result-Zoomable diagram d3.js 2021.01.26
D3, DOM, select, selectAll, .data, .enter, .append, .text, .exit D3 : Data-Driven Document, a JavaScript library for visualizing data with HTML, SVG, and CSS. DOM : Document Object Model : a cross-platform and language-independent interface that treats an XML or HTML document as a tree structure wherein each node is an object representing a part of the document. The DOM represents a document with a logical tree such as html nested body nested h1 so on continu.. d3.js 2021.01.04
maps, geoMercator, geoPath, projection Let's make maps layout with external geojson file. JSON file {"type":"FeatureCollection","features":[ {"type":"Feature","properties":{"name":"Afghanistan"},"geometry":{"type":"Polygon","coordinates":[[[61.210817,35.650072],[62.230651,35.270664],[62.984662,35.404041],[63.193538,35.857166],[63.982896,36.007957],[64.546479,36.312073],[64.746105,37.111818],[65.588948,37.305217],[65.745631,37.661164].. d3.js 2020.12.31
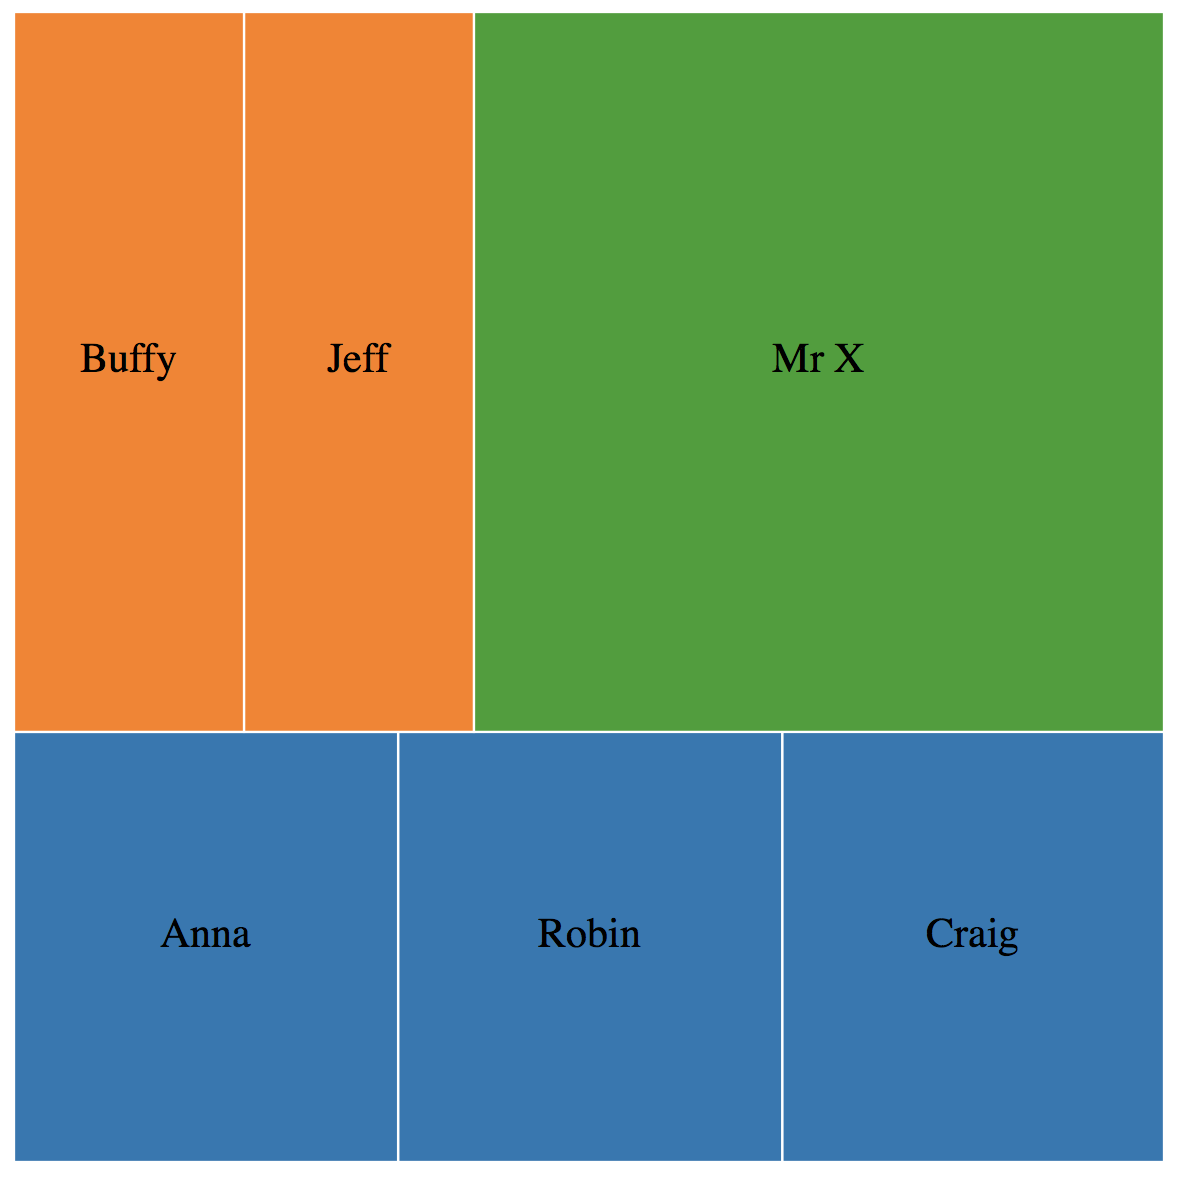
treemap, category10, children, text-anchor Let's create treemap with same json file as previous post(2020/12/29 - [d3.js] - tree layout, tree.nodes, tree.links), ( 2020/12/30 - [d3.js] - cluster). HTML document Result d3.js 2020.12.31
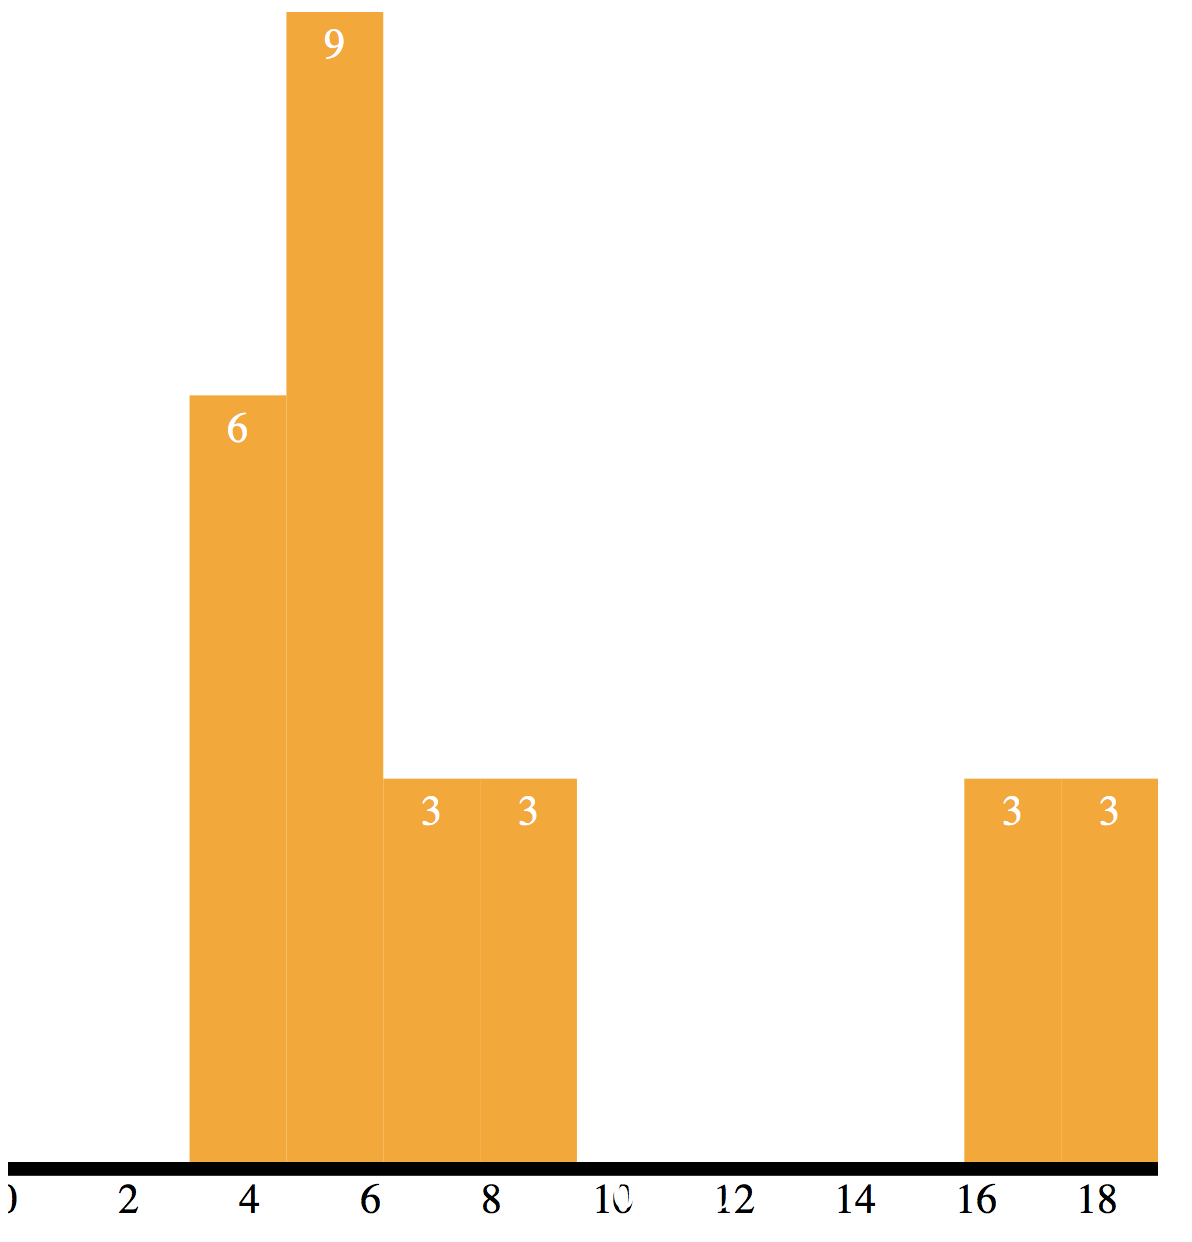
histogram, linear, axis, map Let's decorate the histogram such as convert the chart, apply the text, axis so on following previous post(2020/12/30 - [d3.js] - histogram layout, parseInt). CSV file "name","age" "maria",17 "maria",6 "maria",5 "maria",8 "maria",4 "maria",6 "maria",7 "maria",3 "maria",19 "maria",17 "maria",6 "maria",5 "maria",8 "maria",4 "maria",6 "maria",7 "maria",3 "maria",19 "maria",17 "maria",6 "maria",5 "m.. d3.js 2020.12.31