Following the previous post(2020/12/28 - [d3.js] - scale), let's applied axis, ticks.
<!DOCTYPE html>
<html lang="en">
<head>
<title>D3js</title>
<script src="https://d3js.org/d3.v6.min.js"></script>
</head>
<body>
<script>
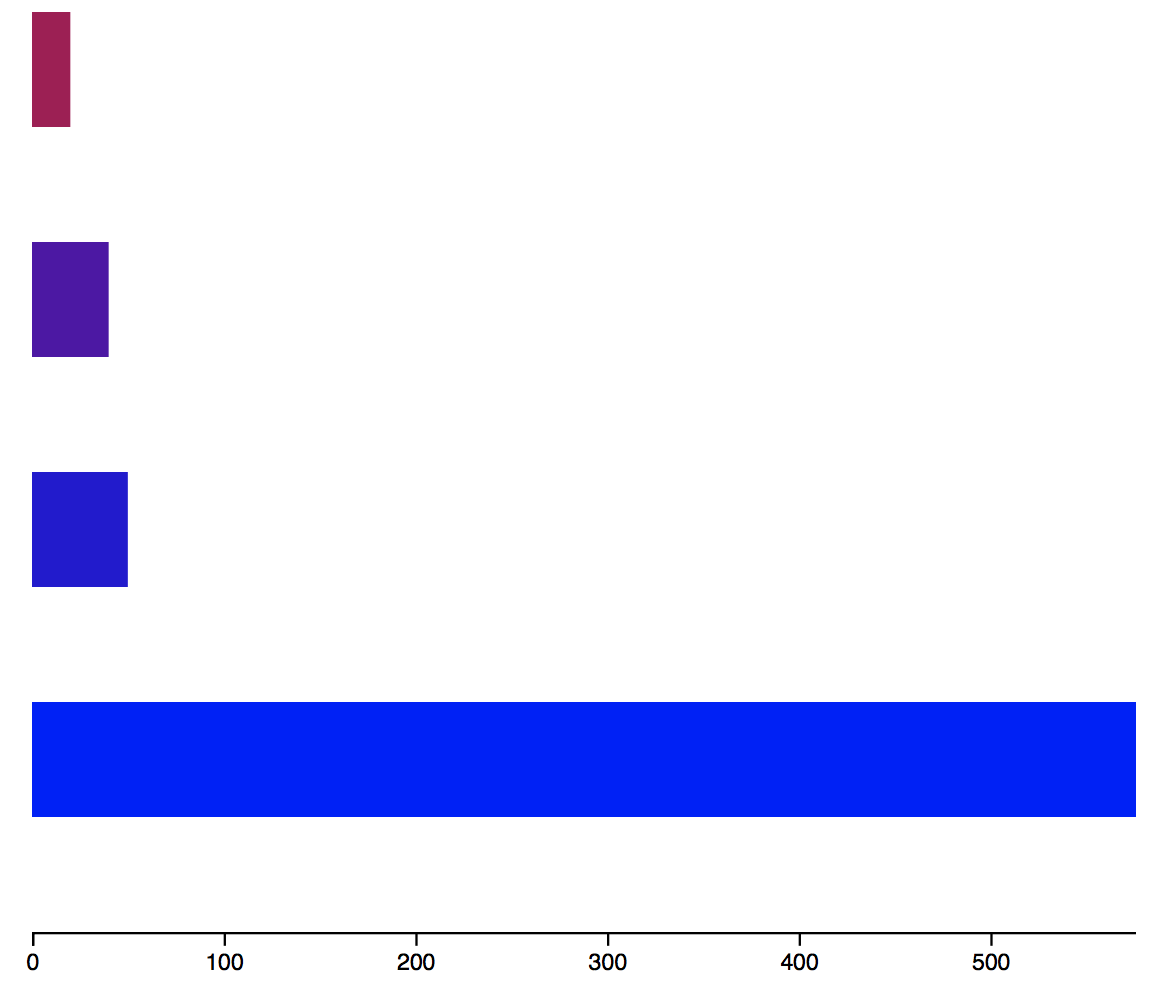
var dataArray = [20,40,50,600];//what if something a strange value would enter into this array such as 600?
var width = 500;
var height = 500;
var widthScale = d3.scaleLinear()
.domain([0,600])//defines original range which the first one is minimum value and second one is the largest value in data
.range([0,width]);//the maximum value should never exceed 500 correspond to the width of my above container
var color = d3.scaleLinear()
.domain([0,60])
.range(["red","blue"])//the smallest value, the largest value
var xAxis = d3.axisBottom(widthScale)//to know what values to display
.ticks(5);//5ticks
//need to use the call method below
var canvas = d3.select("body")
.append("svg")
.attr("width", width) //width is only 500px so everything that exceeds this limits will be chopped off
.attr("height",height) //the name of the variable above
.append("g") //g stands for Group, everything in SVG container is contained withing G tag
.attr("transform", "translate(20, 0)"); //transform is moving the group to the right moving it down the page or rotating it
//translate (x-direction that is the horizontal direction, vertical direction)
var bars = canvas.selectAll("rect") //selectAll : it selects all elements that I specify. select all rectangles
.data(dataArray) //set up containing data, it binds data to rectangles
.enter() //returns placeholders for each data element for which there are no corresponding. It returns a new selection
.append("rect") //these placeholders will append a rectangle
.attr("width", function(d) {return widthScale(d);}) //d stands for each data element that I have in placeholder selection.
.attr("height", 50)
.attr("y", function(d,i){return i*100}) //the first argument(f) contains the data 20,40,50, the second one(i) contains the number the index of each data
//the distance between each rectangle and vertical distance is 100 px
.attr("fill", function (d) {return color(d)});
canvas.append("g")
.attr("transform", "translate(0, 400)")
.call(xAxis);
</script>
</body>
</html>
- Result
'd3.js' 카테고리의 다른 글
| duration, delay, transition, on (0) | 2020.12.28 |
|---|---|
| enter, update, exit (0) | 2020.12.28 |
| scale (0) | 2020.12.28 |
| selectall, enter, function (0) | 2020.12.28 |
| svg, attr (0) | 2020.12.28 |