- RoI(Region of Interest)
A proposed region from the original image. In other words, finding interesting areas. We need to find interesting parts of the image, where the object is.
- Feature extraction
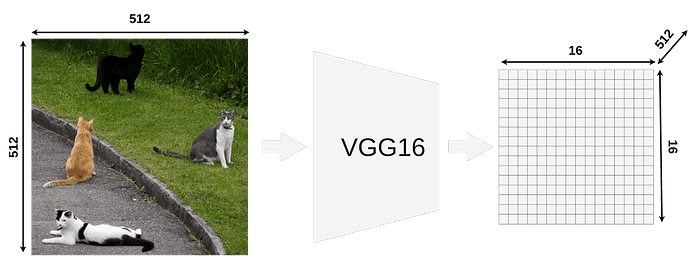
Our model takes an image input of size 512x512x3 (width x height x RGB) and VGG16 is extracting it into a 16x16x512 feature map.
If you look at the output matrix you should notice that it’s width and height is exactly 32 times smaller than the input image (512/32 = 16). That’s important because all RoIs have to be scaled down by this factor.
https://towardsdatascience.com/understanding-region-of-interest-part-1-roi-pooling-e4f5dd65bb44
- Sample RoIs
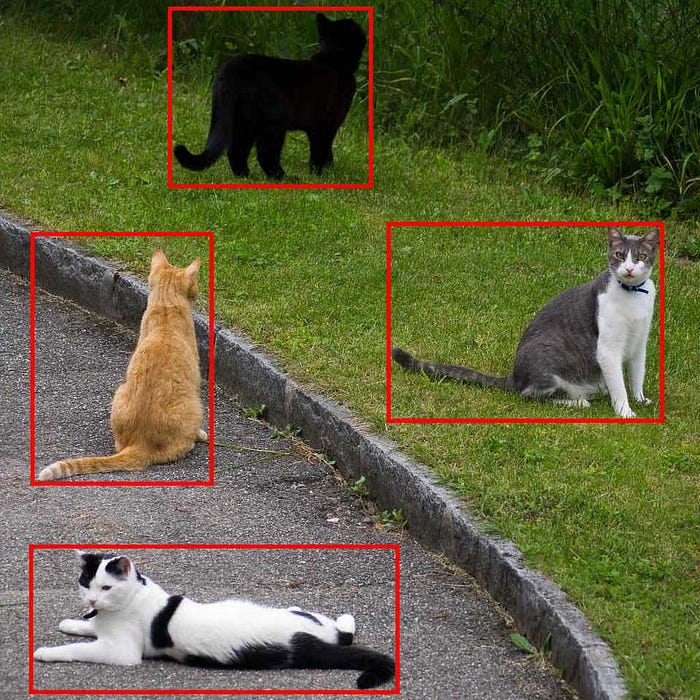
Here we have 4 different RoIs. There are thousands of RoIs but it’s just more convenient way to show only 4 RoIs.

In the actual Fast R-CNN, you might have thousands of RoIs but printing all of them would make image unreadable.
It’s important to remember that RoI is NOT a bounding box. It might look like one but it’s just a proposal for further processing.
- How to get RoIs from the feature map?

Now when we know what RoI is we have to be able to map them onto VGG16’s output feature map.
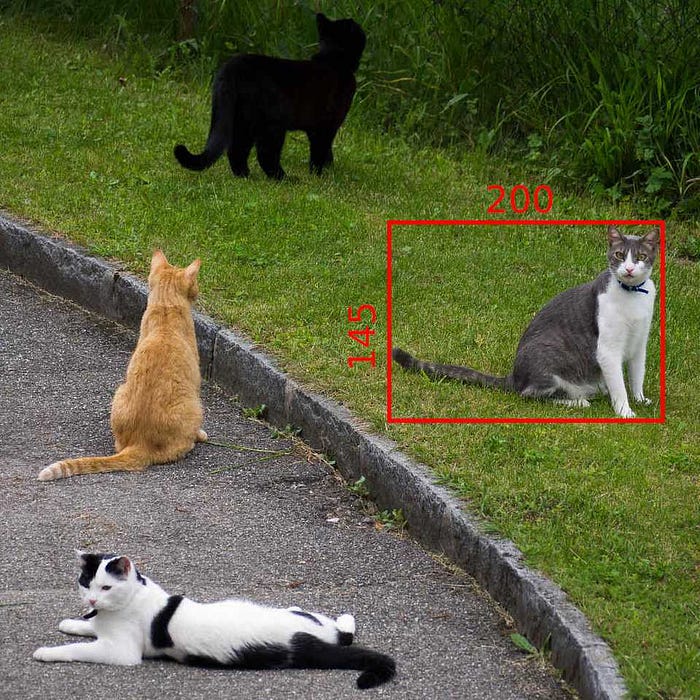
Every RoI has it’s original coordinates and size.
- Quantization
It is a process of constraining an input from a large set of values (like real numbers) to a discrete set (like integers).
- Quantization of coordinates on the feature map

We cannot really apply the pooling layer on it because some of the “cells” are divided. What quantization is doing is that every result is rounded down before placing it on the matrix. 9.25 becomes 9, 4.53 becomes 4, etc.
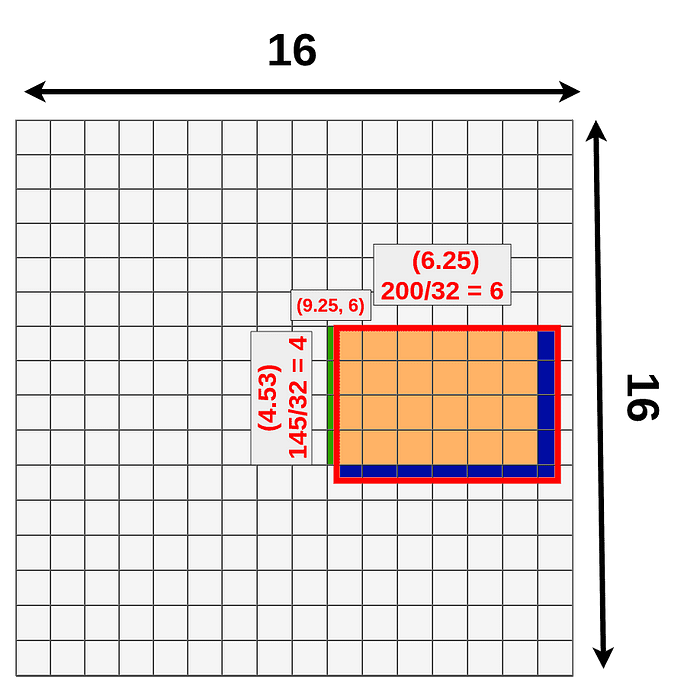
We’ve just lost a bunch of data (dark blue) and gain new data (green).
RoI Align can fix the lost data.
- RoI Pooling
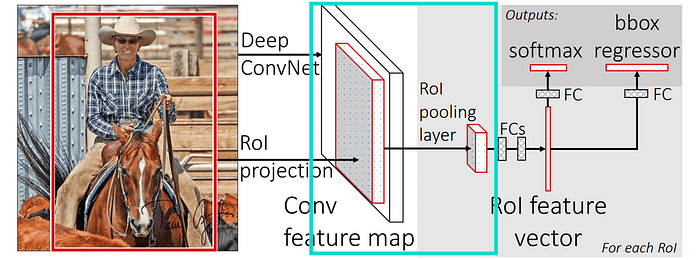
After RoI Pooling Layer there is a Fully Connected layer with a fixed size.
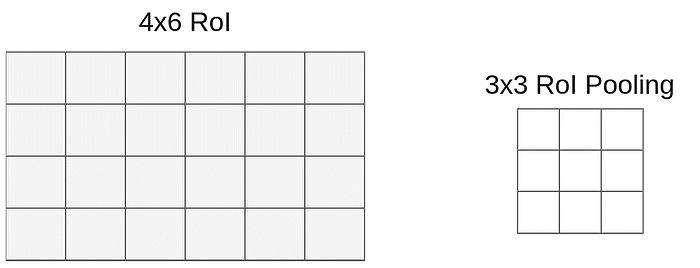
So we have to pool
From our different sizes RoIs : 4x6x512
(Via RoI Pooling)
Into the same sizes RoIs : 3x3x512
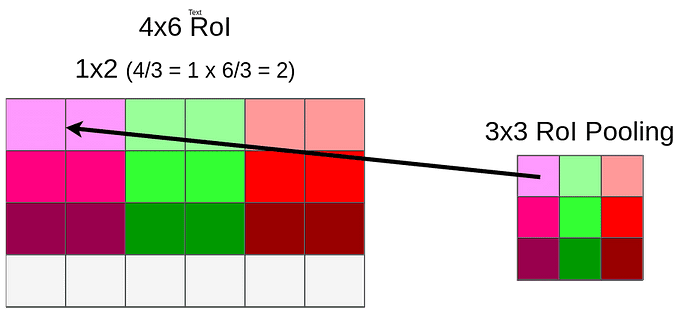
6 could be divided by 3 and it gives 2, but when you divide 4 by 3 we’re left with 1.33. After applying the same method (round down) we have a 1x2 vector.

Because of quantization, we’re losing whole bottom row once again.
Now we can pool data into 3x3x512 matrix.
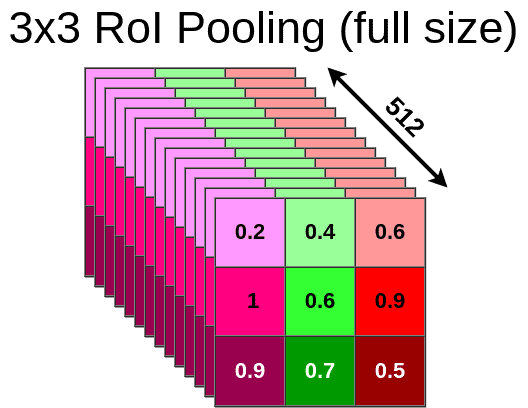
So the end result looks like this.
The same process is applied to every single RoI from our original image so in the end, we might have hundreds or even thousands of 3x3x512 matrixes. Every one of those matrixes has to be sent through the rest of the network (starting from the FC layer). For each of them, the model is generating bbox and class separately.
- RoI Align
It is not using quantization for data pooling.
- Applying bilinear interpolation
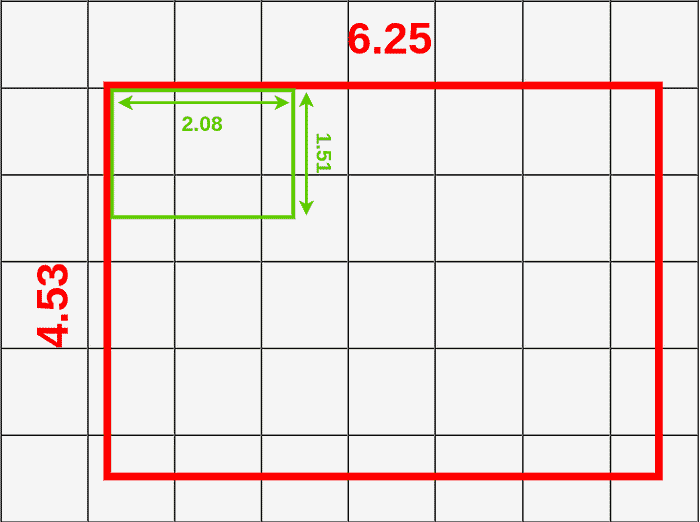
We’re using a 3x3 pooling layer so we have to divide mapped RoI ( 6.25x4.53) by 3. That gives us a box with a height of 1.51 and a width of 2.08.

Now we can put our boxes into mapped RoI.
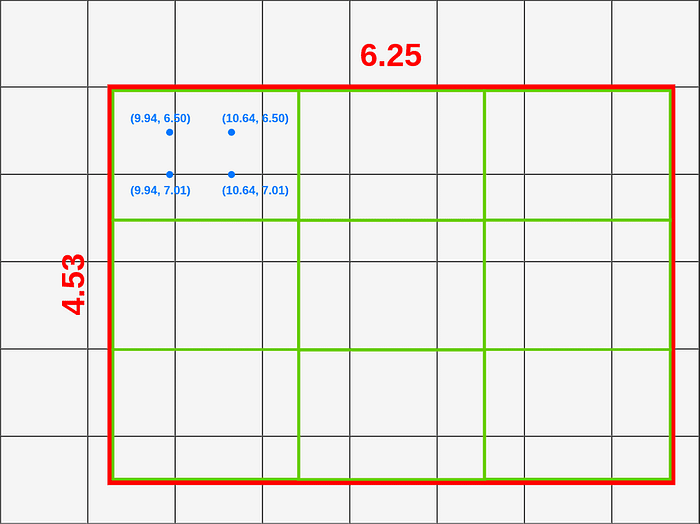
If you look at the first box (top left), you can notice that it covers six different grid cells. To extract value for the pooling layer, we have to sample some data from it. To sample data we have to create four sampling points inside that box.
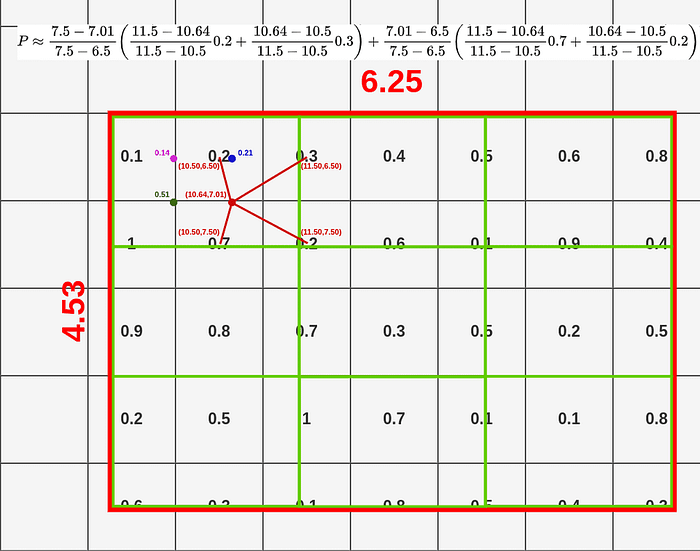
Now when we have all the points we can apply bilinear interpolation to sample data for this box.
Now we have all the points calculated and can apply Max Pooling on them.

The end result contains 512 layers (the same as feature map input).

If you compare data lost/data gain from RoIAlign and RoIPooling you should see that RoIAlign uses the whole area to pool data from.
-green : additional data used for pooling.
-blue (both shades) : data lost when pooling.
'Deep Learning > Object Detection' 카테고리의 다른 글
| (prerequisite-SPPNet) BOVW(Bag Of Visual Words) (0) | 2024.01.24 |
|---|---|
| R-CNN (0) | 2024.01.23 |
| (prerequisite-R-CNN) Non-maximum Suppression(NMS) (0) | 2024.01.23 |
| (prerequisite-R-CNN) Bounding Box Regression (0) | 2024.01.23 |
| (prerequisite-R-CNN) Selective Search (0) | 2024.01.19 |