- Object Detection
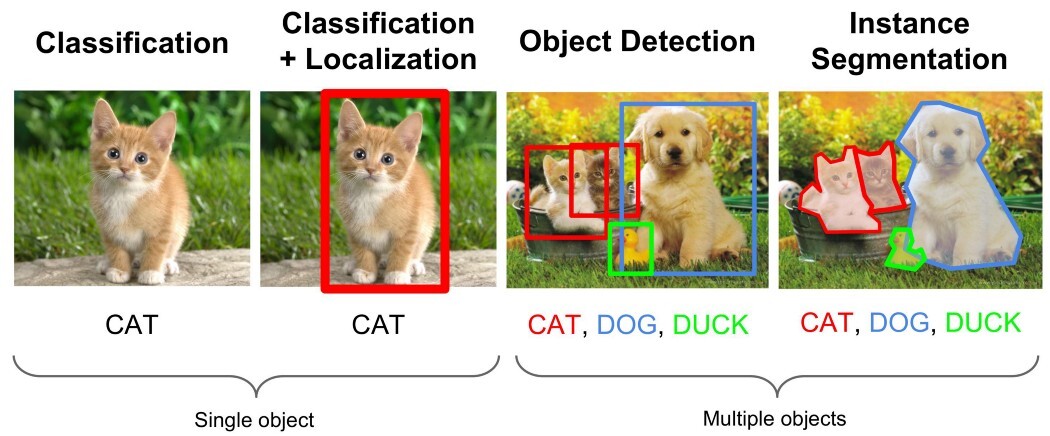
- Image Classification = (single object) Classification
- Image Localization = (single object) Localization, predicting the location of a single object in the Bounding Box.
- Object Detection = (multi objects) Localization + (multi objects) Classification
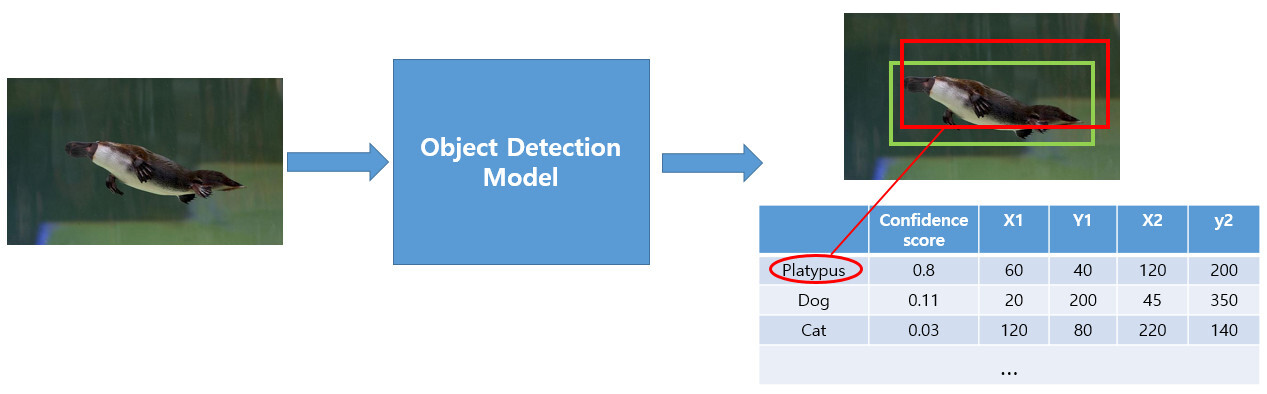
In addition, Object Detection returns the coordinate of the Bounding Box and Confidence Score.
- Bounding Box
It returns the top left coordinate (x1, y1), bottom right coordinate (x2, y2).
- Confidence Score
A 80% probability that the object within the bounding box generated by the model is platypus.
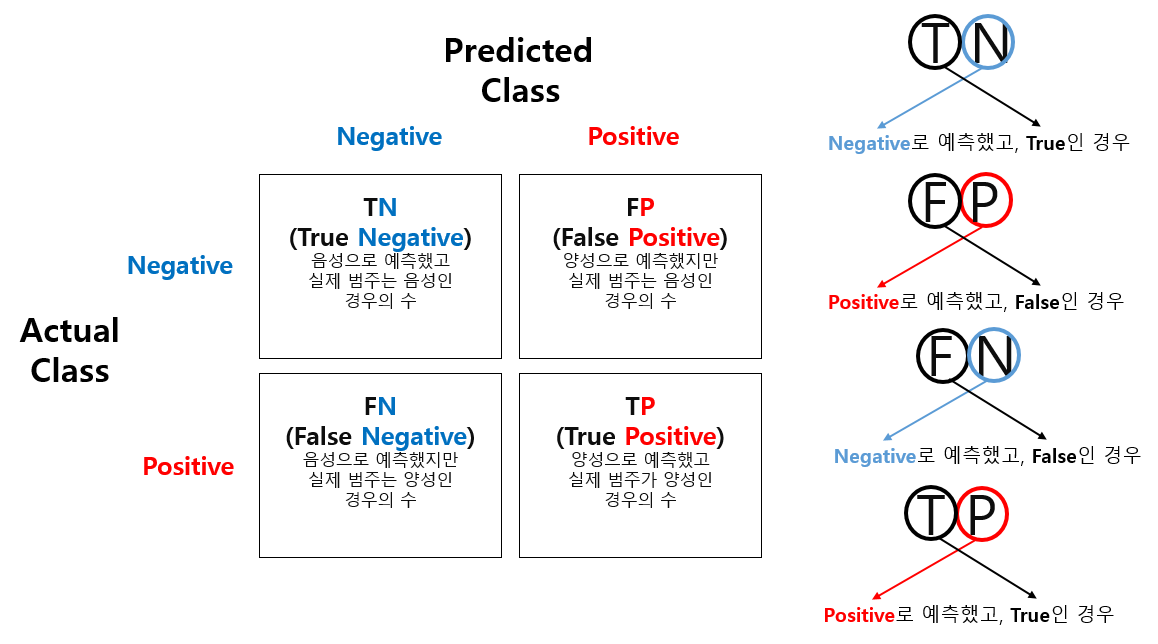
- Precision and Recall
- IoU Threshold & Confidence Score Threshold
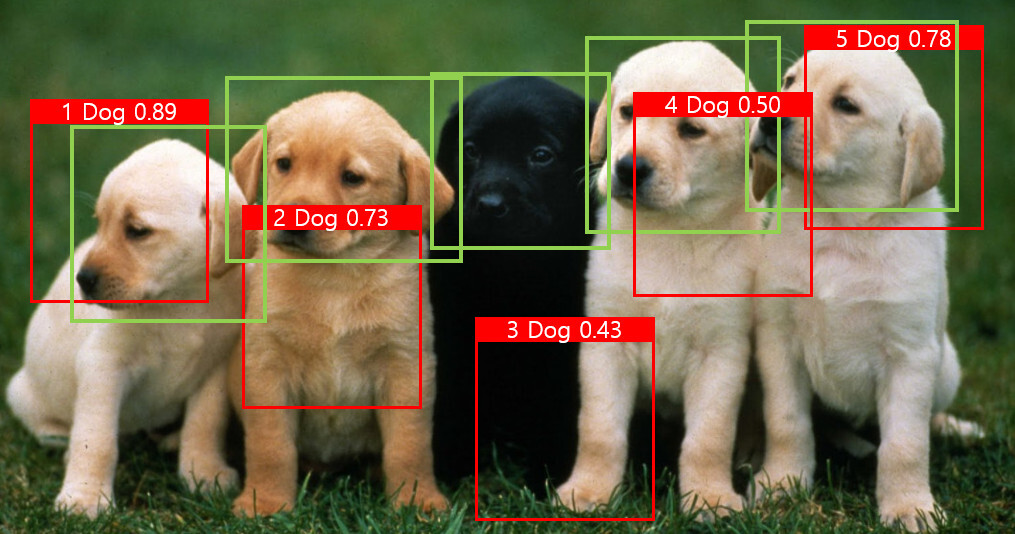
- Positive = Ground truth box = Green box => IoU 0.5
- Predicted box = Red box
- Negative =< IoU 0.5
- True Positive is not used since the purpose is finding the location of a real object.
Example)
- 1, 4, 5 : True Positive, => IoU 0.5
- 2, 3 : False Positive, =< IoU 0.5
- Number of ground truth boxes : 5
- Precision(=TP/(FP+TP))=3/5=0.6
- Recall=(=TP/(FN+TP))=3/4=0.75
- Confidence Score Threshold
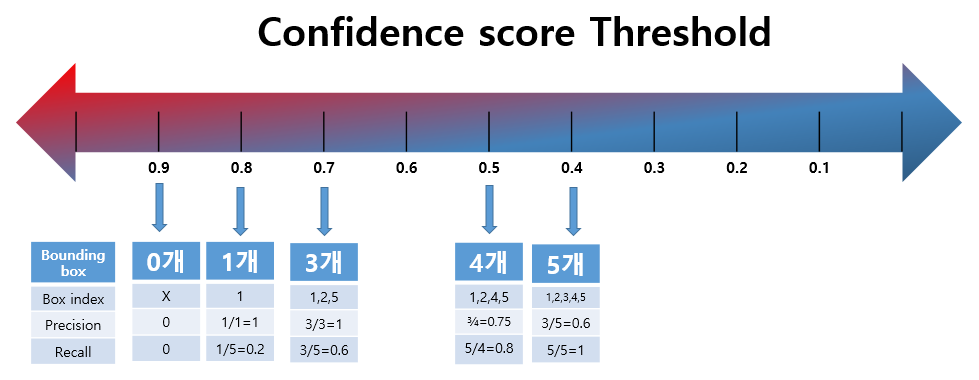
As the threshold of IoU increases, the number of boxes corresponding to TP will decrease, the number of cases corresponding to FP will increase.
- Precision/Recall Trade-off
Confidence Score Threshold ↓, Bounding Boxes ↑, Recall ↑, Precision ↓
Confidence Score Threshold ↑, Bounding Boxes ↓, Recall ↓, Precision ↑
- Precision-Recall Curve

A curve that represents the Precision value according to the change in the Recall value (which is obtained by adjusting the confidence score value).
- AP(Average Precision)
Average Precision that obtained by Precision-Recall Curve. It calculated by AUC(Area Under the Curve). AP curves are often zigzag curves going up and down, and the precision averaged across all recall values between 0 and 1.
- An ilustrated example explaining how to get the AP.
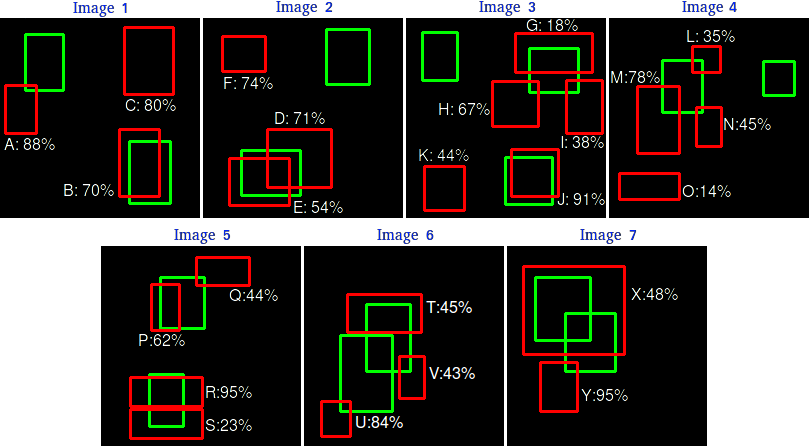
There are 7 images with 15 ground truth objects represented by the green bounding boxes and 24 detected objects represented by the red bounding boxes. Each detected object has a confidence level and is identified by a letter (A,B,...,Y).
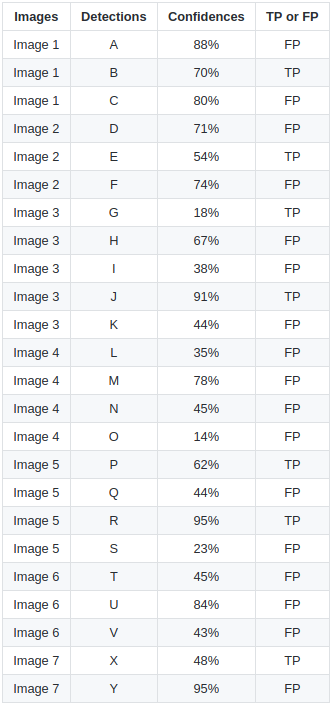
The table shows the bounding boxes with their corresponding confidences. In this example a TP is considered if IOU >= 30%, otherwise it is a FP.
Step 1) Calculating the precision and recall values. Line them up by their confidences.
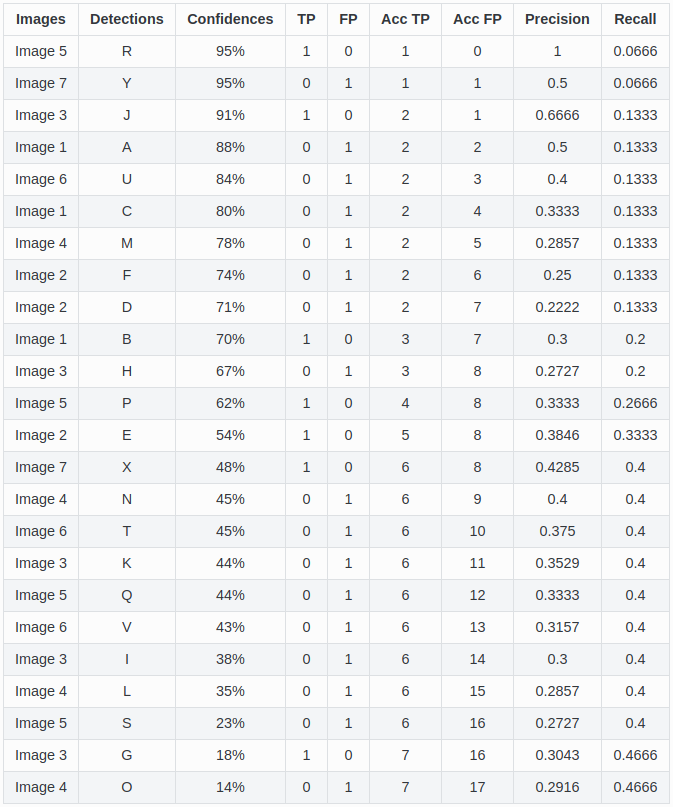
The Precision x Recall curve is plotted by calculating the precision and recall values of the accumulated TP or FP detections. For this, first we need to order the detections by their confidences, then we calculate the precision and recall for each accumulated detection.
Step 2) Plotting the precision and recall values.
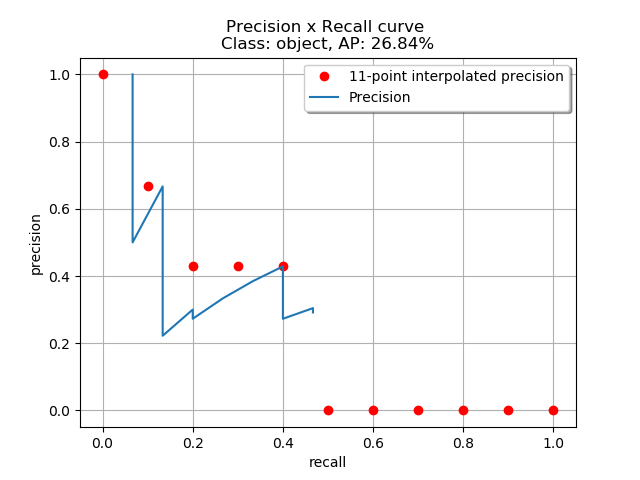
Step 3) Calculating the interpolation.
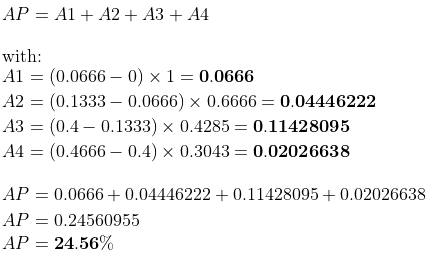
The results between the two different interpolation methods are a little different: 24.56% and 26.84% by the every point interpolation and the 11-point interpolation respectively.
3-1) 11-point interpolation
3-2) All points interpolation
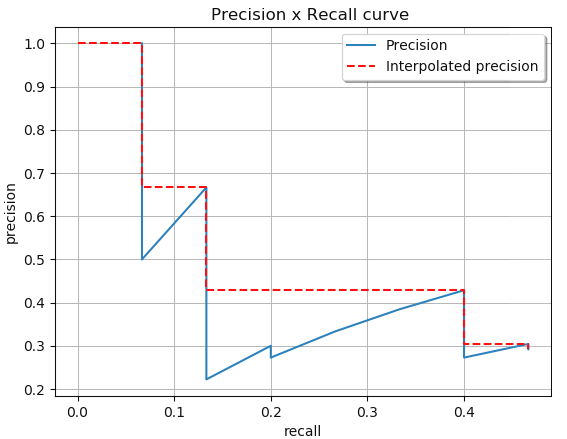
We could visually have the interpolated precision points by looking at the recalls starting from the highest (0.4666) to 0 (looking at the plot from right to left) and, as we decrease the recall, we collect the precision values that are the highest.
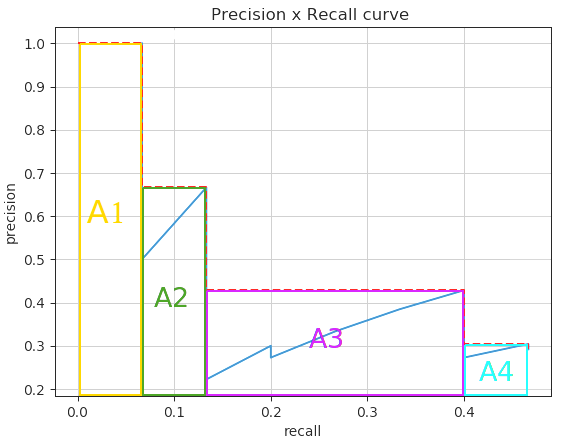
We can divide the AUC into 4 areas (A1, A2, A3 and A4), and calculating the total area.
- mAP(The Mean Average Precision)
The mean of the Average Precision of each image in the data set.
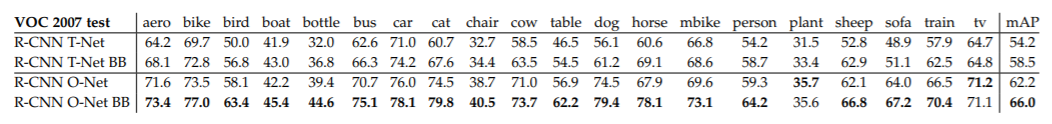
The AP measures for a single object-aero, bike, bird,・・・.
To measure the overall detection performance of the model for all objects, we use a mean average precision (mAP) of all AP values.
In research papers you will see terms such as AP 50 or AP 75, it means that, different IOU threshold.
AP 50 means that we use a 0.5. threshold,
whereas AP 75 means that we use is 0.75 threshold.
https://github.com/rafaelpadilla/Object-Detection-Metrics?tab=readme-ov-file
'Deep Learning > Object Detection' 카테고리의 다른 글
| Image Intensity, Canny (0) | 2024.05.28 |
|---|---|
| YOLO(You Only Look Once) (0) | 2024.02.12 |
| (prerequisite-YOLO) One Stage Object Detection (0) | 2024.02.11 |
| (prerequisite-YOLO) DarkNet (0) | 2024.02.11 |
| Faster RCNN (0) | 2024.01.30 |