1. Supervised Learning
1-1. Classification
-Binary Classification
-Multi-class Classification
-Decision Trees
1-2. Regression
-Linear Regression
1) Simple Linear Regression
2) Multiple Linear Regression
-Polynomial Regression
-Logistic Regression
2. Unsupervised learning
2-1. Clustering
-K-Means Clustering
-Hierarchical Clustering
-DBSCAN (Density-Based Spatial Clustering of Applications with Noise)
2-2. Association
2-3. Dimensionality reduction
The main difference between supervised and unsupervised learning : Labeled data |
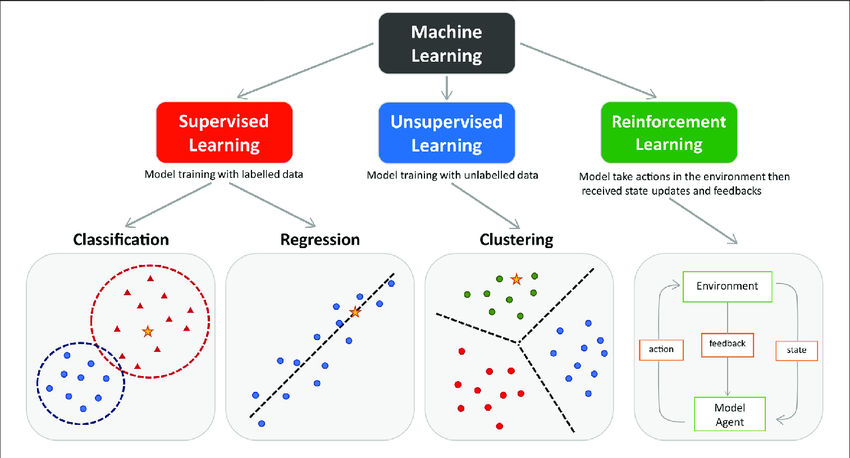
1. Supervised learning
A machine learning approach that’s defined by its use of labeled datasets. These datasets are designed to train or “supervise” algorithms into classifying data or predicting outcomes accurately. Using labeled inputs and outputs, the model can measure its accuracy and learn over time.
- Classification problems use an algorithm to accurately assign test data into specific categories, such as separating apples from oranges. Or, in the real world, supervised learning algorithms can be used to classify spam in a separate folder from your inbox.
- Regression is another type of supervised learning method that uses an algorithm to understand the relationship between dependent and independent variables. Regression models are helpful for predicting numerical values based on different data points, such as sales revenue projections for a given business.
https://medium.com/@natimek2/regression-vs-classification-in-machine-learning-explained-3acd27e00dca
1-1. Classification

- Binary Classification
When an input provides a dataset of distinct features describing each point, the output of the model delivered will be binary labeled representing the two classes i.e., categorical. For example, Yes or No, Positive or Negative.
- Multi-class Classification
It provides more than two outcomes of the model. Their subtypes are one vs all/rest and multi-class classification algorithms. Multiclass does not rely on binary models and classifies the datasets into multiple classes.
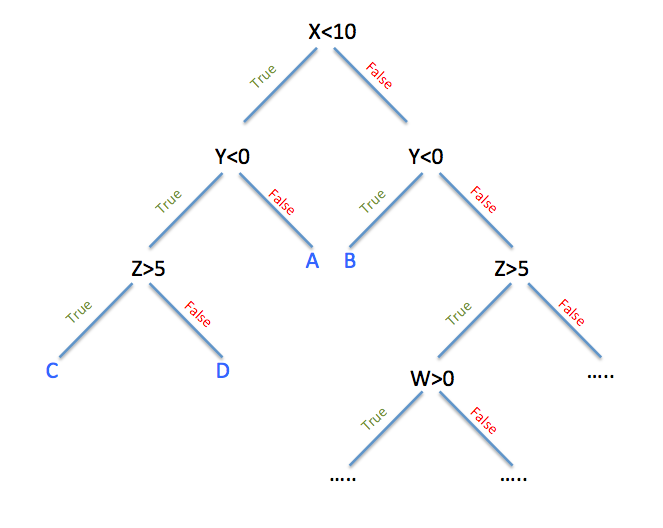
- Decision Trees
It supports binary and multi-class classification tasks. It uses decision trees that start with all the data in the root and progressively split upon different features to generalize the model results. The quality of the split in the decision tree is gauged by the value of entropy or the degree of impurity in the data.
1-2. Regression
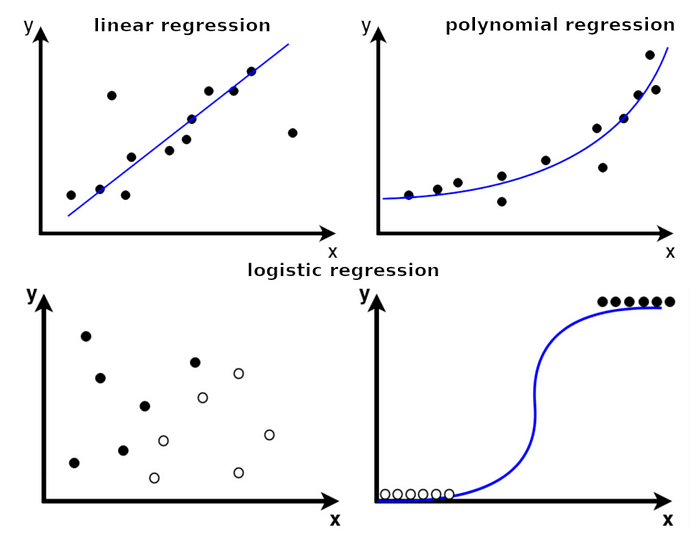
- Linear Regression
It applies linear equations to the datasets. Using a straight line, the relationship between two quantitative variables i.e., one independent and another dependent.
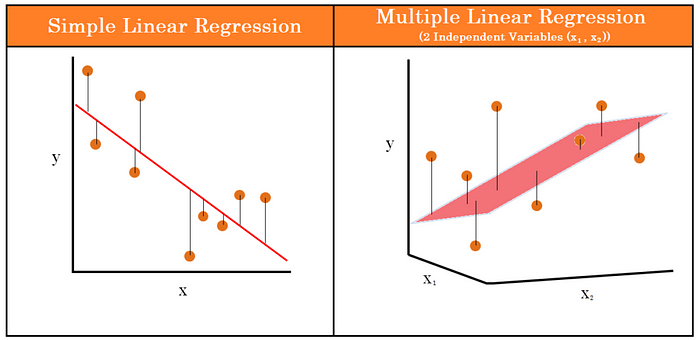
- Simple Linear Regression VS Multiple Linear Regression
Linear regression examines the relationship between one predictor and an outcome, while multiple regression delves into how several predictors influence that outcome.

Difference Between Linear Regression and Multiple Regression: Linear Regression vs Multiple Regression
| Parameter | Linear (Simple) Regression | Multiple Regression |
| Definition | Models the relationship between one dependent and one independent variable. | Models the relationship between one dependent and two or more independent variables. |
| Equation | Y = C0 + C1X + e | Y = C0 + C1X1 + C2X2 + C3X3 + ….. + CnXn + e |
| Complexity | Simpler dealing with one relationship. | More complex due to multiple relationships. |
| Use Cases | Suitable when there is one clear predictor. | Suitable when multiple factors affect the outcome. |
| Assumptions | Linearity, Independence, Homoscedasticity, Normality | Same as linear regression, with the added concern of multicollinearity. |
| Visualization | Typically visualized with a 2D scatter plot and a line of best fit. | Requires 3D or multi-dimensional space, often represented using partial regression plots. |
| Risk of Overfitting | Lower, as it deals with only one predictor. | Higher, especially if too many predictors are used without adequate data. |
| Multicollinearity Concern | Not applicable, as there’s only one predictor. | A primary concern; having correlated predictors can affect the model’s accuracy and interpretation. |
| Applications | Basic research, simple predictions, understanding a singular relationship. | Complex research, multifactorial predictions, studying interrelated systems. |
https://medium.com/@thaddeussegura/multiple-linear-regression-in-200-words-data-8bdbcef34436
https://www.shiksha.com/online-courses/articles/linear-and-multiple-regression/
- Polynomial Regression
To find or model the non-linear relationship between an independent and a dependent variable is called polynomial regression. It is specifically used for curvy trend datasets. Various fields like social science, economics, biology, engineering and physics use a polynomial function to predict the model’s accuracy and complexity. In ML, polynomial regression is applicable to predict customers’ lifetime values, stock and house prices.
- Logistic Regression
It is a model that predicts the probability of an event taking place. It is used to solve classification problems, which means that the dependent variable is always a class or category. (Predicting whether an email is ham or spam, Identifying the species of an animal based on its image, Classifying website traffic as benign or malicious).
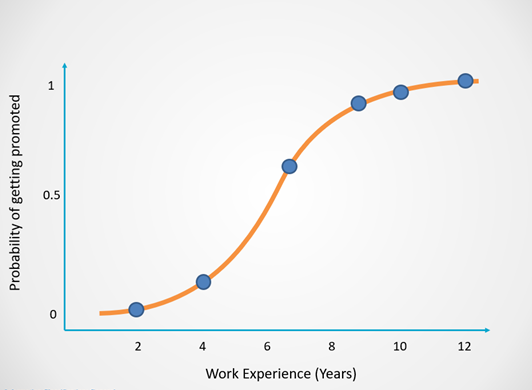
- Why do we need logistic regression — Why can’t we simply use a straight line(Linear regression) to predict?
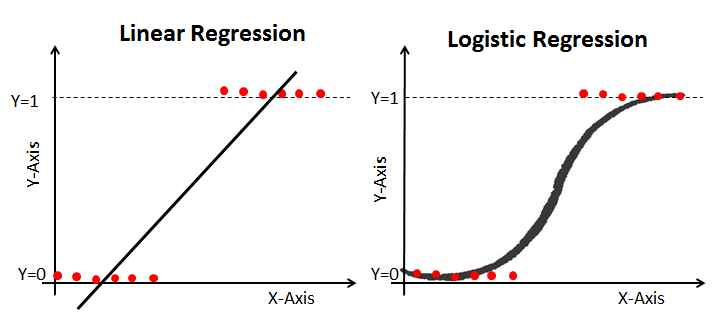
https://www.natasshaselvaraj.com/logistic-regression-explained-in-7-minutes/
https://hackernoon.com/introduction-to-machine-learning-algorithms-logistic-regression-cbdd82d81a36
2. Unsupervised learning
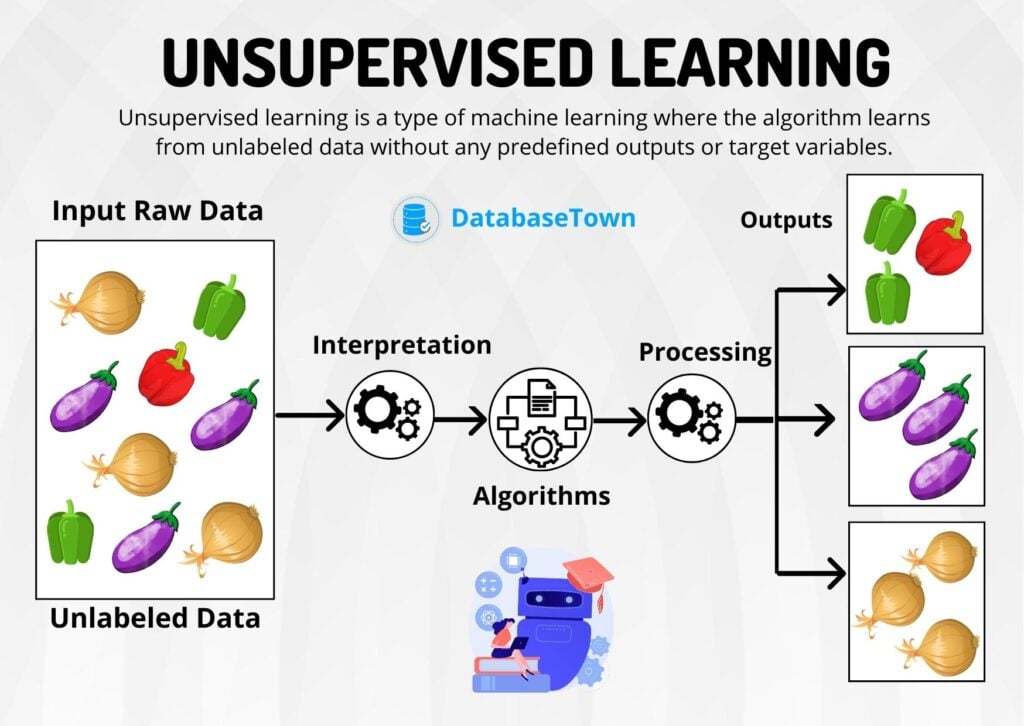
It uses machine learning algorithms to analyze and cluster unlabeled datasets. These algorithms discover hidden patterns in data without the need for human intervention (hence, they are “unsupervised”).
- Clustering is a data mining technique for grouping unlabeled data based on their similarities or differences. For example, K-means clustering algorithms assign similar data points into groups, where the K value represents the size of the grouping and granularity. This technique is helpful for market segmentation, image compression, etc.
- Association is another type of unsupervised learning method that uses different rules to find relationships between variables in a given dataset. These methods are frequently used for market basket analysis and recommendation engines, along the lines of “Customers Who Bought This Item Also Bought” recommendations.
- Dimensionality reduction is a technique used to reduce the number of features in a dataset while retaining as much of the important information as possible. In other words, it is a process of transforming high-dimensional data into a lower-dimensional space that still preserves the essence of the original data.
2-1. Clustering
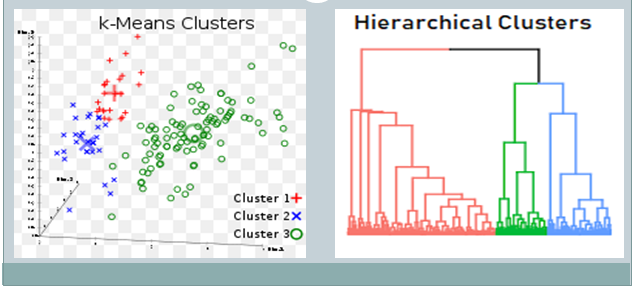

- K-Means Clustering: In this algorithm, data is divided into a specific number of groups or clusters. It is achieved by minimizing the total squared distances between the data points and the centers of each cluster.
- Hierarchical Clustering: Hierarchical clustering develops a hierarchy of clusters by merging or splitting them depending on their similarity.
- DBSCAN (Density-Based Spatial Clustering of Applications with Noise): DBSCAN identifies clusters as dense regions of data points separated by sparser regions.
2-2. Association
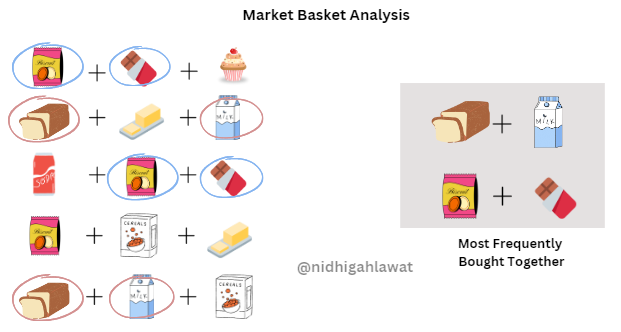
By analyzing the purchase data of a shop, the algorithm may discover that customers who buy bread are also likely to purchase milk or that customers who buy biscuits often accompany their purchase with chocolate. Such insights empower businesses to strategically position related items closer to each other to enhance customer experience and drive sales.
2-3. Dimensionality reduction
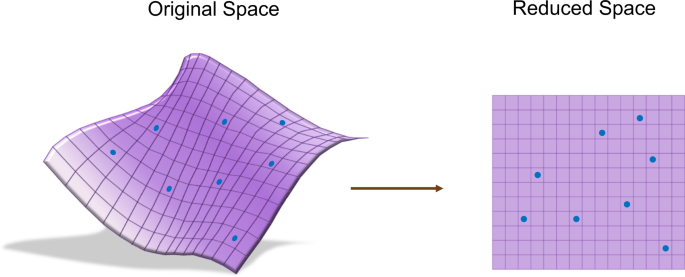
It is a powerful technique used to reduce the number of features in a dataset while preserving its important patterns and relationships. It is particularly useful when dealing with high-dimensional data, where visualizing and analyzing the data can be challenging.
https://freedium.cfd/https://towardsdatascience.com/dimensionality-reduction-cheatsheet-15060fee3aa
'Machine Learning' 카테고리의 다른 글
| Variance VS Bias, Bias&Variance Trade-off (0) | 2023.10.31 |
|---|---|
| model.parameters (0) | 2023.01.17 |
| 3D Tensor(Typical Natural Language Processing) (0) | 2022.08.02 |
| tensorflow (0) | 2022.03.16 |
| Glance ML (0) | 2022.03.11 |