- pandas
It is a software library written for the Python programming language for data manipulation and analysis. In particular, it offers data structures and operations for manipulating numerical tables and time series.
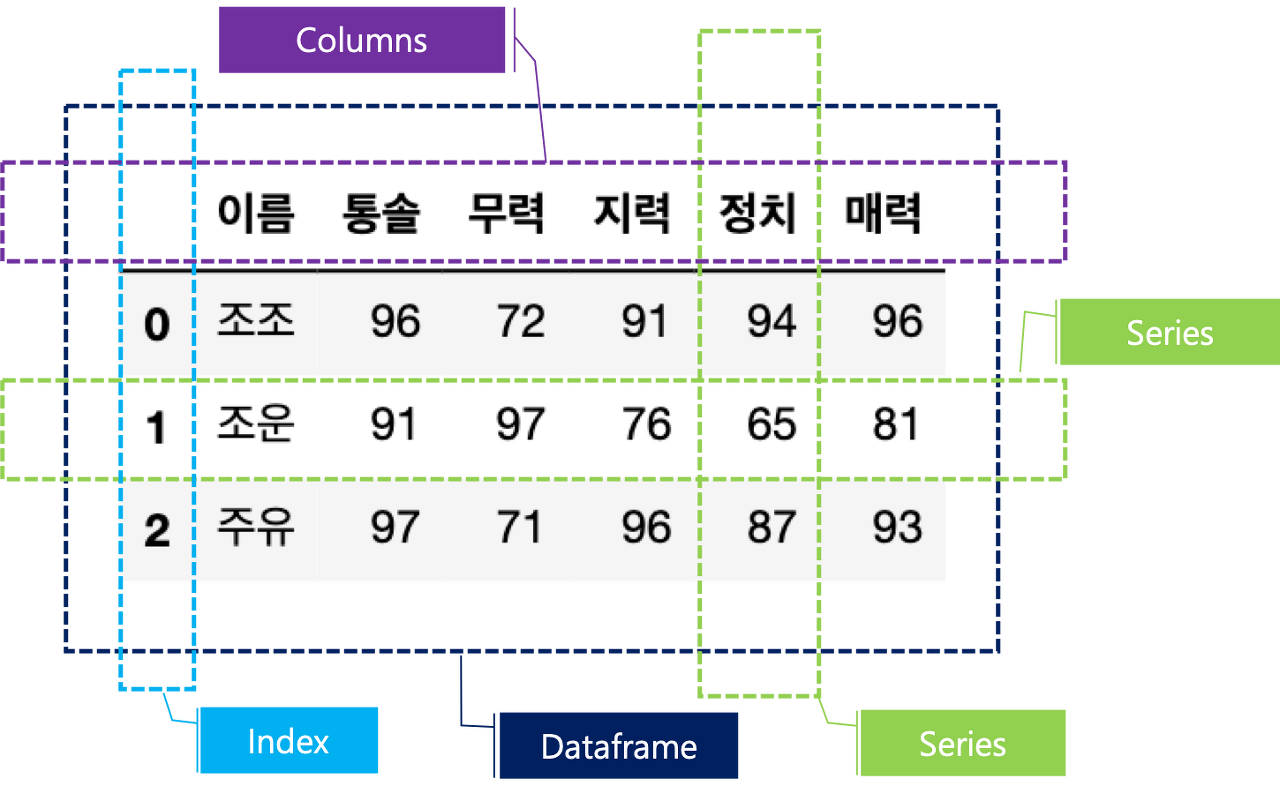
1. Series
One-dimensional array with values and index can be granted to each values.
import pandas as pd

sr=pd.Series([1000,2000,3000,4000],index=['aaa','bbb','ccc','ddd'])
sr
>>>aaa    1000
bbb    2000
ccc    3000
ddd    4000
dtype: int64
import pandas as pd
infos={'name':'jojo','governance':'91'}
pd.Series(infos)
>>>
name jojo
governance 91When change the values of Series, it uses tuple.
a[['attractiveness','politics']]=(100,200)
a
>>>
name              jangbi
governance            90
politics             200
attractiveness       100
- reindex
Change the sequence.
import pandas as pd
infos={'name':'jojo','governance':91,'politics':80}
s1=pd.Series(infos)
s1
>>>
name          jojo
governance      91
politics        80

s1=s1.reindex(['name','politics'])
s1
>>>
name          jojo
politics        80
governance      91
- isnull
Detect missing values. It return True if there is missing values. It returns bool.
a.isnull()
>>>
name              False
governance        False
politics          False
attractiveness    False
df.isnull().values.any()
- notnull
Detect existing (non-missing) values. It return True if there is existing (non-missing) values. It returns bool.
a.notnull()
>>>
name              True
governance        True
politics          True
attractiveness    True
- fillna
It replaces all NaN elements with other value using inplace=True.
s.fillna(5,inplace=True)
s
>>>
0     1.0
1     2.0
2     3.0
3     5.0
4     1.0
5     2.0
6     3.0
7     5.0
8     1.0
9     2.0
10    3.0
11    5.0
dtype: float64
- method='ffill' : Forward Fill, fill the NaN with forward value.
- method='bfill' : Backward Fill, fill the NaN with backward value.
- drop
Delete the index and value using inplace=True
a.drop('governance', inplace=True)
a
>>>
politics          200
attractiveness    100
- dropna
Drop NaN value.
- how=all : Drop all NaN
- randn
Random Normal, generates a matrix filled with random floats samples from a normal distribution of mean 0 and variance 1.
s=pd.Series(np.random.randn(10))
s
>>>
0   -0.139915
1    0.756593
2    3.953420
3    0.059873
4   -0.536376
5    1.089905
6    0.143042
7   -0.309413
8   -0.273029
9 0.696348| 함수 | 설명 |
| rand(d0, d1, …, dn) | 주어진 차원으로 임의의 값을 반환 |
| randn(d0, d1, …, dn) | "표준 정규"분포에서 주어진 차원으로 임의의 값을 반환 |
| randint(start, stop) | Return a randum number between start and stop |
| random_sample([size]) | 0.0 <= val < 1.0 사이의 float을 size 만큼 반환 |
| random([size]) | 0.0 <= val < 1.0 사이의 float을 size 만큼 반환 |
- describe
Generate descriptive statistics including those that summarize the central tendency, dispersion and shape of a dataset's distribution, excluding NaN values.
s.describe()
>>>
count    10.000000
mean      0.544045
std       1.308795
min      -0.536376
25%      -0.239750
50%       0.101457
75%       0.741532
max       3.953420
- nan
Not a Number, it doesn't count.
s=pd.Series([1,2,3,np.nan]*3)
s
>>>
0     1.0
1     2.0
2     3.0
3     NaN
4     1.0
5     2.0
6     3.0
7     NaN
8     1.0
9     2.0
10    3.0
11    NaN
- value_counts
Return a Series containing counts of unique values in descending order so that the first element is the most frequently-occurring element. Excludes NA values by default.
- dropna=False : It shows NaN index values.
s=pd.Series([1,2,3,np.nan]*3)
s.value_counts(dropna=False)
>>>
3.0    3
NaN    3
2.0    3
1.0    3
- normalize=True : It contains the frequencies of the unique values.
s.value_counts(normalize=True)
>>>
3.0    0.333333
2.0    0.333333
1.0    0.333333
- map
Mapping the values.
mapping={1:'high',2:'mid',3:'low',5:'other'}
s.map(mapping)
s.map('class is {0}'.format)
>>>
0    class is 1
1    class is 2
2    class is 3
3    class is 1
4    class is 2
5    class is 3
6    class is 1
7    class is 2
8    class is 3
list(s.map(lambda x:x**2))
>>>
[1, 4, 9, 1, 4, 9, 1, 4, 9]
- apply
It used when it calls the function.
def calc(value):
    return value+10

s.apply(calc)
0    11
1    12
2    13
3    11
4    12
5    13
6    11
7    12
8    13
dtype: int64
s.apply(lambda value:value+5)
0 6
1 7
2 8
3 6
4 7
5 8
6 6
7 7
8 8
dtype: int64def calc(value, par):
return value+par
s.apply(calc, args=(5,))
0 6
1 7
2 8
3 6
4 7
5 8
6 6
7 7
8 8
dtype: int64
- concat
Concatenate, merging two Pandas Series into a DataFrame creates a DataFrame with the two Series as columns.
df=pd.concat([IP,PORT], axis=1)
df.head()

>>>
IP	Port
0	183.203.180.184	80
1	95.174.64.70	80
2	185.13.223.1	80
3	45.152.182.114	80
4	106.75.7.109	443
- unique
Return unique values of series.
NTM_df['DRULE_ATT_TYPE_CODE1'].unique()

>>>
array(['Attack', 'Malwr'], dtype=object)'Analyze Data > Python Libraries' 카테고리의 다른 글
| pandas-5. json_normalize (0) | 2021.10.25 |
|---|---|
| mlxtend-TransactionEncoder, association_rules (0) | 2021.06.23 |
| pandas-4. read_csv, unique, to_csv, file upload, file download (0) | 2021.06.22 |
| numpy-array, arange, reshape, slicing, newaxis, ...(Ellipsis) (0) | 2021.05.25 |
| pandas-2. DataFrame (0) | 2021.05.25 |